The non-central chi-squared distribution is a generalisation of the regular chi-squared distribution. The chi-squared distribution turns up in many statistical tests as the (approximate) distribution of a test statistic under the null hypothesis. Under alternative hypotheses, those same statistics often have approximate non-central chi-squared distributions.
This means that the non-central chi-squared distribution is often used to study the power of said statistical tests. In this post I give the definition of the non-central chi-squared distribution, discuss an important invariance property and show how to efficiently sample from this distribution.
Definition
Let  be a normally distributed random vector with mean
  and covariance
  . Given a vector
  , the non-central chi-squared distribution with
  degrees of freedom and non-centrality parameter
  is the distribution of the quantity

This distribution is denoted by  . As this notation suggests, the distribution of
  depends only on
  , the norm of
  . The first few times I heard this fact, I had no idea why it would be true (and even found it a little spooky). But, as we will see below, the result is actually a simply consequence of the fact that standard normal vectors are invariant under rotations.
Rotational invariance
Suppose that we have two vectors  such that
  . We wish to show that if
  , then
has the same distribution as  .
.
Since and  have the same norm there exists an orthogonal matrix
  such that
  . Since
  is orthogonal and , we have
  . Furthermore, since is orthogonal, preserves the norm
  . This is because, for all
  ,
,

Putting all these pieces together we have
 .
.
Since and  have the same distribution, we can conclude that
  has the same distribution as
  . Since
  , we are done.
Sampling
Above we showed that the distribution of the non-central chi-squared distribution,  depends only on the norm of the vector . We will now use this to provide an algorithm that can efficiently generate samples from .
A naive way to sample from would be to sample independent standard normal random variables  and then return
  . But for large values of this would be very slow as we have to simulate auxiliary random variables for each sample from . This approach would not scale well if we needed many samples.
An alternative approach uses the rotation invariance described above. The distribution depends only on and not directly on . Thus, given , we could instead work with  where
where  is the vector with a
  in the first coordinate and s in all other coordinates. If we use instead of , we have

The sum  follows the regular chi-squared distribution with
  degrees of freedom and is independent of
  . The regular chi-squared distribution is a special case of the gamma distribution and can be effectively sampled with rejection sampling for large shape parameter (see here).
The shape parameter for is  , so for large values of we can efficiently sample a value
  that follows that same distribution as
  . Finally to get a sample from we independently sample , and then return the sum
  .
.
Conclusion
In this post, we saw that the rotational invariance of the standard normal distribution gives a similar invariance for the non-central chi-squared distribution.
This invariance allowed us to efficiently sample from the non-central chi-squared distribution. The sampling procedure worked by reducing the problem to sampling from the regular chi-squared distribution.
The same invariance property is also used to calculate the cumulative distribution function and density of the non-central chi-squared distribution. Although the resulting formulas are not for the faint of heart.
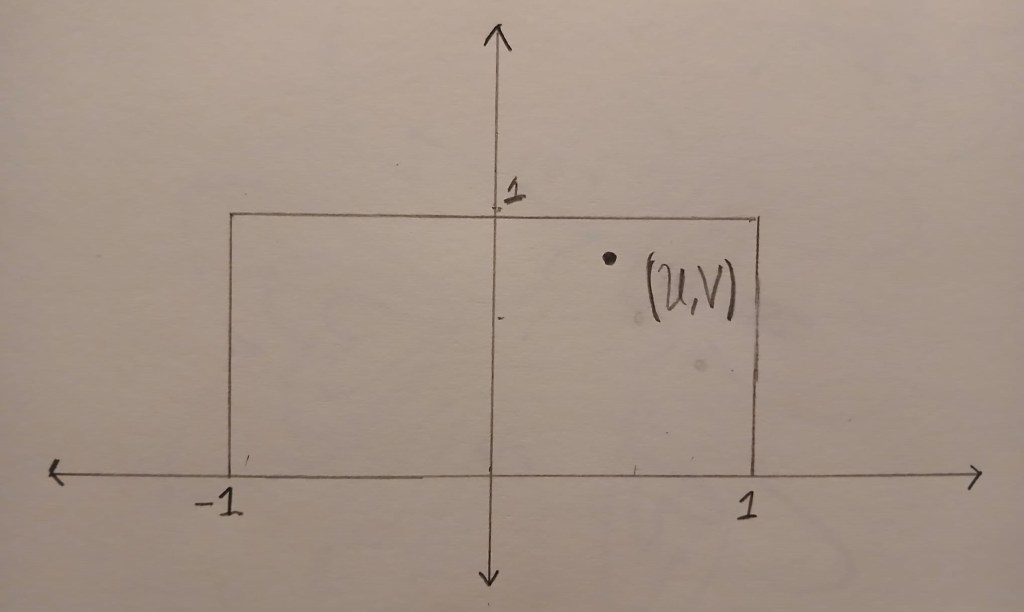
![U \in [-1,1]](https://s0.wp.com/latex.php?latex=U+%5Cin+%5B-1%2C1%5D&bg=ffffff&fg=333333&s=0&c=20201002)
![V \in [0,1]](https://s0.wp.com/latex.php?latex=V+%5Cin+%5B0%2C1%5D&bg=ffffff&fg=333333&s=0&c=20201002)


![B=[-1,1] \times [0,1]](https://s0.wp.com/latex.php?latex=B%3D%5B-1%2C1%5D+%5Ctimes+%5B0%2C1%5D&bg=ffffff&fg=333333&s=0&c=20201002)


![[R,R+dR]](https://s0.wp.com/latex.php?latex=%5BR%2CR%2BdR%5D&bg=ffffff&fg=333333&s=0&c=20201002)
![\displaystyle{\frac{\text{Area}(\{(u,v) \in B : u/v \in [R, R+dR]\})}{\text{Area}(B)} = \frac{1}{2}\text{Area}(\{(u,v) \in B : u/v \in [R, R+dR]\}).}](https://s0.wp.com/latex.php?latex=%5Cdisplaystyle%7B%5Cfrac%7B%5Ctext%7BArea%7D%28%5C%7B%28u%2Cv%29+%5Cin+B+%3A+u%2Fv+%5Cin+%5BR%2C+R%2BdR%5D%5C%7D%29%7D%7B%5Ctext%7BArea%7D%28B%29%7D+%3D+%5Cfrac%7B1%7D%7B2%7D%5Ctext%7BArea%7D%28%5C%7B%28u%2Cv%29+%5Cin+B+%3A+u%2Fv+%5Cin+%5BR%2C+R%2BdR%5D%5C%7D%29.%7D&bg=ffffff&fg=333333&s=0&c=20201002)
![\displaystyle{h(R) = \lim_{dR \to 0} \frac{1}{2dR}\text{Area}(\{(u,v) \in B : u/v \in [R, R+dR]\})}.](https://s0.wp.com/latex.php?latex=%5Cdisplaystyle%7Bh%28R%29+%3D+%5Clim_%7BdR+%5Cto+0%7D+%5Cfrac%7B1%7D%7B2dR%7D%5Ctext%7BArea%7D%28%5C%7B%28u%2Cv%29+%5Cin+B+%3A+u%2Fv+%5Cin+%5BR%2C+R%2BdR%5D%5C%7D%29%7D.&bg=ffffff&fg=333333&s=0&c=20201002)

![\{(u,v) \in B : u/v \in [R, R+dR]\}](https://s0.wp.com/latex.php?latex=%5C%7B%28u%2Cv%29+%5Cin+B+%3A+u%2Fv+%5Cin+%5BR%2C+R%2BdR%5D%5C%7D&bg=ffffff&fg=333333&s=0&c=20201002)


![\displaystyle{\text{Area}(\{(u,v) \in B : u/v \in [R, R+dR]\}) =\frac{1}{2}\times dR \times 1=\frac{dR}{2}}.](https://s0.wp.com/latex.php?latex=%5Cdisplaystyle%7B%5Ctext%7BArea%7D%28%5C%7B%28u%2Cv%29+%5Cin+B+%3A+u%2Fv+%5Cin+%5BR%2C+R%2BdR%5D%5C%7D%29+%3D%5Cfrac%7B1%7D%7B2%7D%5Ctimes+dR+%5Ctimes+1%3D%5Cfrac%7BdR%7D%7B2%7D%7D.&bg=ffffff&fg=333333&s=0&c=20201002)
![R \in [-1,1]](https://s0.wp.com/latex.php?latex=R+%5Cin+%5B-1%2C1%5D&bg=ffffff&fg=333333&s=0&c=20201002)


![\displaystyle{\text{Area}(\{(u,v) \in B : u/v \in [R, R+dR]\}) =\frac{1}{2}\times \frac{dR}{R(R+dR)} \times 1=\frac{dR}{2R(R+dR)}}.](https://s0.wp.com/latex.php?latex=%5Cdisplaystyle%7B%5Ctext%7BArea%7D%28%5C%7B%28u%2Cv%29+%5Cin+B+%3A+u%2Fv+%5Cin+%5BR%2C+R%2BdR%5D%5C%7D%29+%3D%5Cfrac%7B1%7D%7B2%7D%5Ctimes+%5Cfrac%7BdR%7D%7BR%28R%2BdR%29%7D+%5Ctimes+1%3D%5Cfrac%7BdR%7D%7B2R%28R%2BdR%29%7D%7D.&bg=ffffff&fg=333333&s=0&c=20201002)

and
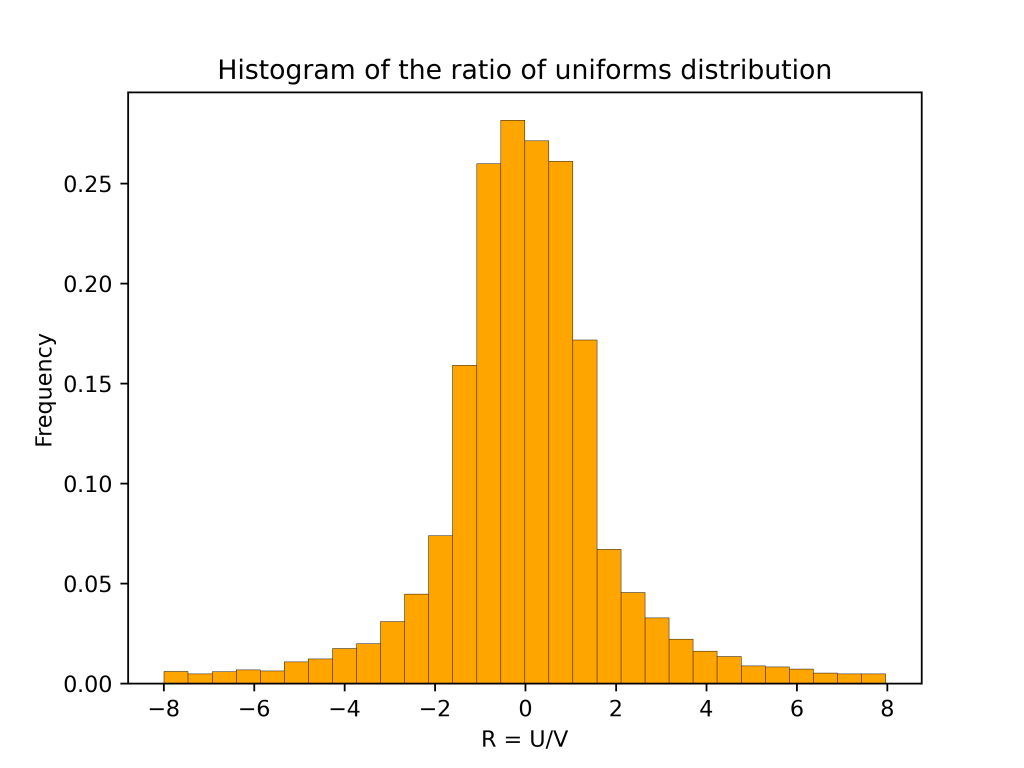
. This is because the ratio of uniform distribution has heavy tails. This meant that there were some very large values of
 and we want to sample from the probability distribution
  That is
 is a normalizing constant. If the set
  is very large, then it may be difficult to compute
  . To approximately sample from
  , we add a auxiliary variable
  such that
 ![\displaystyle{P(U \mid X) = \prod_{i=1}^n \mathrm{Unif}[0,f_i(X)]}.](https://s0.wp.com/latex.php?latex=%5Cdisplaystyle%7BP%28U+%5Cmid+X%29+%3D+%5Cprod_%7Bi%3D1%7D%5En+%5Cmathrm%7BUnif%7D%5B0%2Cf_i%28X%29%5D%7D.&bg=ffffff&fg=333333&s=0&c=20201002)
 , the auxiliary variables
  are independent and
  is uniformly distributed on the interval
 ![[0,f_i(X)]](https://s0.wp.com/latex.php?latex=%5B0%2Cf_i%28X%29%5D&bg=ffffff&fg=333333&s=0&c=20201002) . If
. If  and
and ![\displaystyle{P(X,U) =P(X)P(U\mid X)\propto \prod_{i=1}^n f_i(X) \frac{1}{f_i(X)} I[U_i \le f(X_i)] = \prod_{i=1}^n I[U_i \le f(X_i)]}.](https://s0.wp.com/latex.php?latex=%5Cdisplaystyle%7BP%28X%2CU%29+%3DP%28X%29P%28U%5Cmid+X%29%5Cpropto++%5Cprod_%7Bi%3D1%7D%5En+f_i%28X%29+%5Cfrac%7B1%7D%7Bf_i%28X%29%7D+I%5BU_i+%5Cle+f%28X_i%29%5D+%3D+%5Cprod_%7Bi%3D1%7D%5En+I%5BU_i+%5Cle+f%28X_i%29%5D%7D.&bg=ffffff&fg=333333&s=0&c=20201002)
 is uniform on the set
 . Then, the above calculation shows that if we discard
  from
from  and then sampling
  from
from  . Since the joint distribution of
  and
and  .
.
 , it might be difficult to do this. Fortunately, there are some notable examples where this step has been worked out. The very first example of auxiliary variables is the Swendsen-Wang algorithm for sampling from the Ising model [2]. In this model it is possible to sample uniformly from
  . Another setting where we can sample exactly is when
  and each